How should investors make sense of the recent dramatic gyrations in stock and bond markets in the context of the phenomenal spread of covid-19? Our macro-based models suggest that the equity market correction and decline in real bond yields were for the most part consistent with markets pricing in, over the past year, a trending rise in uncertainty about a low and stagnant long-term real economic growth. One way to think about the effects of Covid-19 is that it is an additional source of uncertainty.

As shown in Exhibit 1, US equity markets lost about 28% of their value from February 19th to March 24th, erasing all gains from the past year – a drawdown all too reminiscent of the first market losses in October 2008. At the same time the VIX, a measure of short-term risk or stock return variability over therecent past, shot up and more than quadrupled from its near historical lows of 14 to about 60, peaking at 82 on March 16th- around the highest values reached during the 2008 global financial crisis! Of course, these figures will change daily, and possibly in an extreme way.
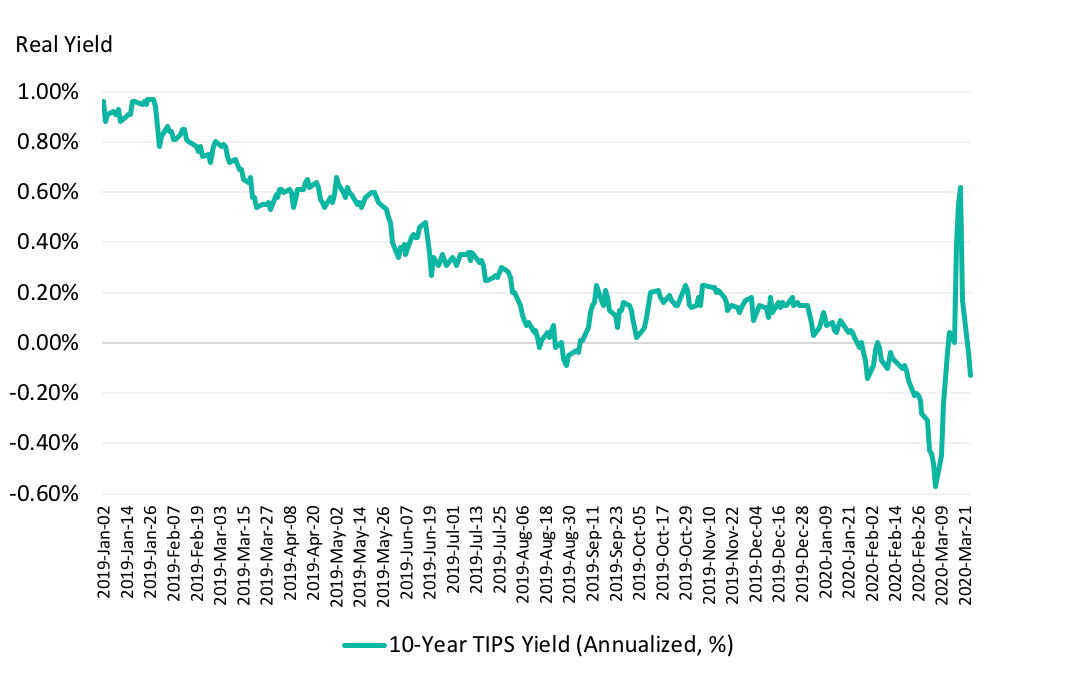
As for bond markets, according to Exhibit 2, the yield on US 10-year real bonds (TIPS) experienced a roller coaster ride. Following a year of continued decline, the yield went below zero on January 28th and fell further about 57bps through March 6th. It then bounced back to 62bps on March 19th before dropping again the following day and through March 24th near but below zero at -13bps.
How should investors approach these wild gyrations in markets and understand the nature of uncertainties they are signaling? To grapple with these issues, investors should keep their focus on the long-term drivers of economic growth. In particular, the question boils down to whether or not such short-term changes in markets price in higher uncertainties about long-term, real economic growth. To us, the implication is that the transmission of Covid-19 to the economy and markets depends on whether the economic shocks last for long periods of time.
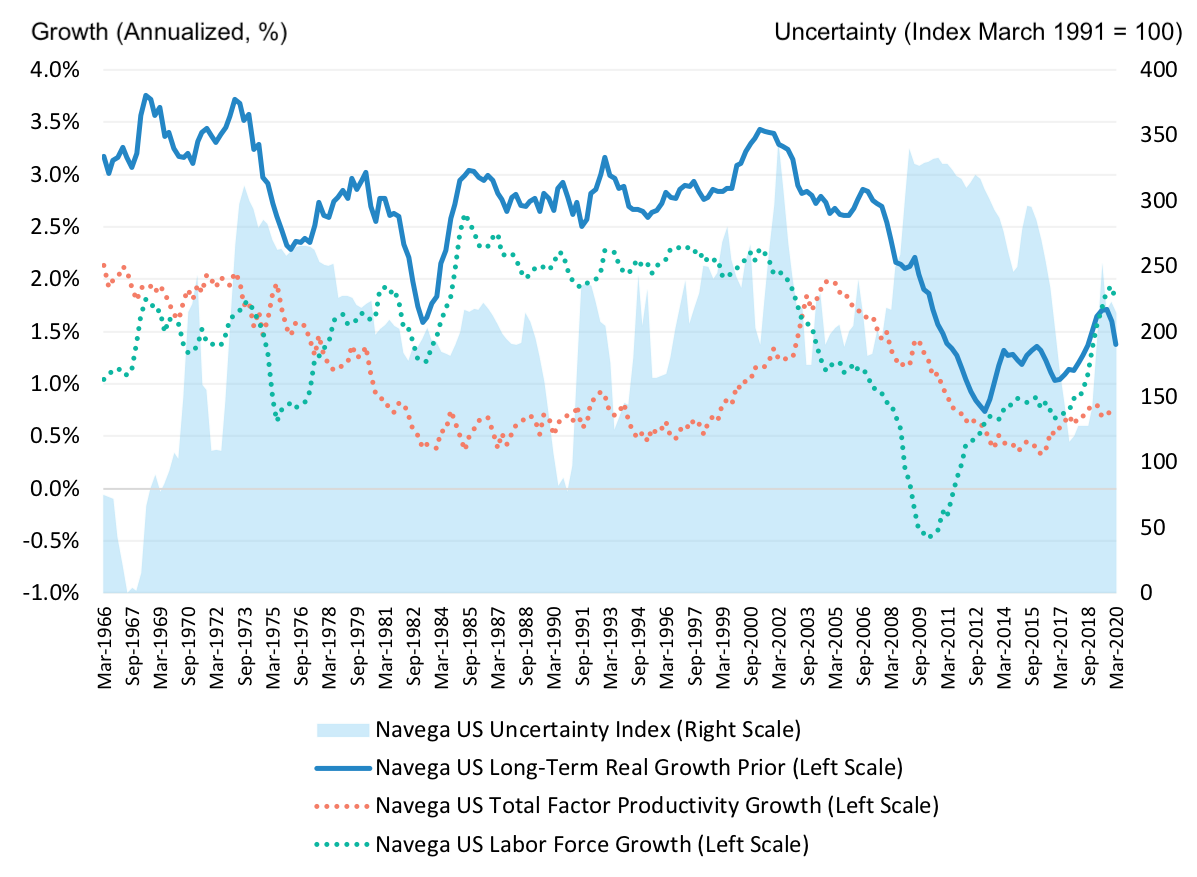
Exhibit 3 shows how our macro-based models that link macroeconomic fundamentals to asset values in a consistent fashion can help better understand these complex connections. According to our models, macroeconomic uncertainty about relatively low and stagnant real economic growth has been increased by about 50% since March 2017. Although this increase is significant, it still pales relative to the experience of the 2008 Global Financial Crisis. Our models also suggest that recent market moves are consistent with markets pricing in this rising uncertainty. In some sense, the surprise could be not that equity markets sold off, but rather that they took so long to do so.
As for bond markets, the trending decline in real yields is consistent with investors’ demand for insurance in the face of higher uncertainty about long-term growth. The past week’s surge in yields reflects monetary policy responses to help mitigate a possibly acute liquidity crunch leading to solvency crises similar to the 2008 experience, with sudden flows into shorter maturity bonds and money markets to address short-term funding needs.
Of course, the appearance of covid-19 and the policy responses to it add uncertainty about long-term growth. Our models provide insights into the key drivers of long-term trend economic growth: growth in the labor force (workers) and growth in total factor productivity (TFP). The latter reflects the impact of innovation and efficient allocation of resources on economic growth, after taking into account the effect of capital and labor. Both the growth in active population and in TFP have remained relatively low since the 2008 global financial crisis compared to their historical average trend. And TFP growth has been stubbornly stagnant.
Going forward, the key question for investors is whether or not covid-19 will have a lasting negative impact on labor force growth and TFP growth. Unfortunately, the timing of the resolution of this risk is itself uncertain, with potential consequences at this stage that are hard to measure! In such situations, investors are well advised to continue monitor signals to changes in the drivers of long-term growth. Some analysts are already revising their growth expectations to reflect a severe downturn spread over both the current and the next quarter. Our models indicate that increases in uncertainty could lead to further corrections in the equity market, with real bond yields skimming at near-zero levels or below for a prolonged period of time. Subsequent notes will explore alternative scenarios of growth and uncertainty in the US and other major economies including China, along with their impact on returns.
This document is for informational purposes only. This document is intended exclusively for the person to whom it has been delivered, and may not be reproduced or redistributed to any other person without the prior written consent of Navega Strategies LLC (“Navega”). The information contained herein is based on Nageva’s proprietary research analytics of data obtained from third party statistical services, company reports or communications, publicly available information, or other sources, believed to be reliable. However, Navega has not verified this information, and we make no representations whatsoever as to its accuracy or completeness. Navega does not intend to provide investment advice through this document. This document is in no way an offer to sell or a solicitation of an offer to buy any securities. Investing in securities involves risk of loss, including a loss of principal, that clients should be prepared to bear. Past performance is not indicative of future results, which may vary materially. While this summary highlights important data, it does not purport to capture all dimensions of risk. The methodology used to aggregate and analyze data may be adjusted periodically. The results of previous analyses may differ as a result of those adjustments. Navega has made assumptions that it deems reasonable and used the best information available in producing any calculations herein. Statements that are nonfactual in nature, including opinions, projections and estimates, assume certain economic conditions and industry developments and constitute only current opinions that could be incorrect and are subject to change without notice. All information provided herein is as of the delivery date the document (unless otherwise specified) and is subject to modification, change or supplement in the sole discretion of Navega without notice to you. This information is neither complete nor exact and is provided solely as reference material with respect to the services offered by Navega. Information throughout this document, whether stock quotes, charts, articles, or any other statement or statements regarding market or other financial information, is obtained from sources which we and our suppliers believe reliable, but we do not warrant or guarantee the timeliness or accuracy of this information. The information presented here has not been personalized, and is not based on the financial circumstances of the recipient. This information may not be applicable to your particular financial needs, and should not, by itself, be used to make determinations regarding the purchase or sale of securities, or other investment decisions.
The model performance information presented is based on the application of Navega’s factor analysis, backtested against actual historical data. “Backtesting” is a process of objectively simulating historical performance information by applying a set of rules backward in time. The results of the application of Navega’s model do not reflect actual performance or actual historical data. Such models are prepared with the full benefit of hindsight, and it is not likely that similar results could be achieved in the future.
The model portfolios were constructed by Navega with the benefit of hindsight to illustrate certain performance metrics. The performance shown was not actually achieved by any investor. The investments in these hypothetical portfolios were selected with the full benefit of hindsight, after performance over the period shown was known. It is not likely that similar results could not be achieved in the future. The hypothetical portfolios presented here are purely illustrative, and representative only of a small sample of possible scenarios.
The projections shown do not represent actual performance, and are based on assumptions which may not occur. It is possible that the markets will perform better or worse than shown in the projections, the actual results of an investor who invests in the manner these projections suggest will be better or worse than the projections, and an investor may lose money by relying on these projections.